25/5/10

Varias representaciones de la península en Ptolomeo


Mapa España. 1561.Hispania según Geographia de Ptolomeo (Tabvla Evropae II) 1561. Edición de Venecia. Girolamo Ruscelli, basado en la edición de 1548 de Giacomo Gastaldi.

Mapa España. XVII. Mercator.


Mapa de España. Siglo XVII. Joannem Jansonium


España. XIX.
Mapa de España. Tomás López. 1802. Mapa general de España dedicado el Príncipe de Asturias


Ptolomeo.es es una página comercial de venta de mapas, globos, cartas marinas y grabados que encuentro particularmente interesante porque da para comparar la representación cartográfica y de vistas de mismos sitios durante varios periodos, como es el caso de la representación de la peníncula en las imágenes de arriba en el que podemos cómo los procesos geológicos han tenido lugar, de forma inconsciente, en la imaginación de los cartógrafos.

Aquí dos ejemplos más de joyitas que podemos encontrar por su archivo:


Mapa Biscaiae Pars. XVI.
Mapa calcográfico en blanco y negro. Carta marina en perfecto estado que cubre la costa desde Laredo hasta Llanes. Texto en latín y holandés. La costa se ve en perspectiva desde mar adentro. Hay barcos, monstruos marinos, escalas y gran cartela con decoración vegetal. Texto posterior en francés. Perteneciente al atlas "Espejo del mar" publicado por el piloto y cartógrafo Waghenaer. Detalla las profunidades de la bahía de Laredo y Santander. Es la primera carta marina impresa de las costas del norte de España. Muy rara.


Principios del XIX. Maison Delamarche. Francia. Esfera Armillar.

Project Chariot plans


Plans to use five thermonuclear explosions to create an artificial harbor at Cape Thompson, Alaska, for Project Chariot in 1958. It was eventually cancelled amid controversy and protest. The outer-outline represents the "full scale" plan, which would require detonations totalling 2.4 megatons. The inner outline is a scaled down version, of 460 kilotons. It would be eventually scaled down to 280 kilotons.

From Wikipedia.

Topic Map: How Sciencetific Paradigms relate


A MAP OF SCIENCE created by Sandian Kevin Boyack with collaborators Richard Klavans and Brad Paley, resembles a filamentous microorganism you might see under a microscope.

The map represents 800,000 scientific papers (shown as white dots) and shows relationships between them and different scientific disciplines. The "filaments" are common words unique to each "scientific paradigm" — the 776 red circular nodes or clusters of papers. Each node contains papers that are commonly cited together. Larger nodes have more papers. Nodes are connected with lines of various lengths and thicknesses, denoting the strength of the citation linkages between the nodes. Layout of the nodes was done using Sandia's VxOrd clustering algorithm. Chemistry papers are found in the right-hand peninsula while astrophysics is located at the top. Medicine covers the large region at the lower left.

A four-foot-by-four-foot version of the map is on display at the New York Hall of Science until Feb. 25 as part of the "Places & Spaces: Mapping Science" exhibition. This image also appeared in the Gallery section of the 2006 year-end issue of Nature (vol. 444, p. 985).

Boyack, a founding member of the advisory board of Places & Spaces, produced the map in collaboration with Klavans, SciTech Strategies of Berwyn, Pa., and Paley, graphic artist and director of Information Esthetics, New York, N.Y., using 2003 data from Thomson ISI. It was enabled by work performed under a Laboratory Directed Research and Development project whose purpose was to generate large-scale maps of science for planning and evaluation purposes.

For more information on interpreting the map see Paley’s website http://didi.com/brad/mapOfScience. For details on the exhibition see http://www.scimaps.org.

19/5/10

Francis Alÿs: Fabiola, 1994


Artist : Francis Alÿs
Fabiola, Installation View, National Portrait Gallery, London


Essay by Lynne Cooke


Francis Alÿs, Fabiola—An Investigation, 1994 –

This collection of works, all bearing the profiled image of a young woman in a crimson cloak, was begun some fifteen years ago. Now comprising almost three hundred items, it is installed here for the first time in a museum as a collection.1 Viewed en masse, its striking cohesiveness depends on the fact that every work not only depicts the same subject—the Christian saint known as Fabiola (d. 399 AD) —but also strictly adheres to the same iconographic formulation. All are, in fact, replicas. Given the composition’s manifest simplicity, it is highly unlikely that the image was copied for the usual pedagogical reasons—as either an exercise in acquiring technical skills or refining an academic style. Even if some appear to have been created for a religious market or to serve devotional needs, most betray the hands of novices, amateurs, or Sunday painters.

In 1885, a French academician, Jean-Jacques Henner, created the definitive, albeit ficticious, portrayal of Fabiola.2 The prototype for all these works, Henner’s disarmingly conventional rendering owed its repute to a bestseller. An inspirational hagiography in the guise of a romantic historical novel of the kind popularized by Sir Walter Scott, the melodrama Fabiola, or The Church of the Catacombs (1854) by the British Cardinal Wiseman gave rise to a cult devoted to this formerly obscure female saint. Riding the wave of the evangelical Catholic revival then sweeping Western Europe, Henner’s depiction had its visual sources in the portraiture of secular subjects developed by the Bellinis and others working in fifteenth-century Venice. So widely venerated was his devotional image that it ensured both its subject and its creator considerable renown. Alongside the myriad printed reproductions that have long flooded mass markets throughout the Christian world, handcrafted and painted versions by amateurs and professionals alike continue to be limned over a century later.

(...)


Más en thisistomorrow.

Gender art net


GenderArtNet is an experimental mapping project exploring the interrelation of gender, ethnicity, race, class and sexualities in contemporary Europe.

GenderArtNet’s primary aim is to thematically link the various existing online resources of feminist and queer artists, projects and networks rather than provide yet another user platform for artist profiles. By connecting existing, often remote, online resources, we would like to improve the accessibility and readability of these resources while keeping the memory of feminist artistic and cultural production in the broader Europe alive.

By organising this information in a map, we work to provide contexts, connections, and relations between artists, artworks and networks and between geopolitics and artistic practice. Our starting point is a relational understanding of feminism as a critical, multilayered practice that considers the interrelatedness of various forms of social, political and cultural hierarchies and exclusions along the lines of gender, sexuality, ethnicity, bodily ability, race, class and geopolitical location.


A través de Ptqk, sabemos del proyecto en el cuál colabora Gender art net en el que también están envueltos la gente de Constantvz.

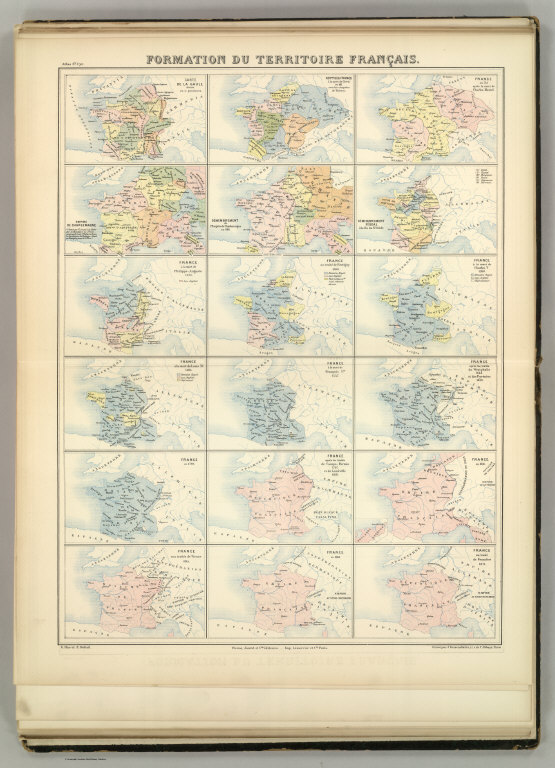
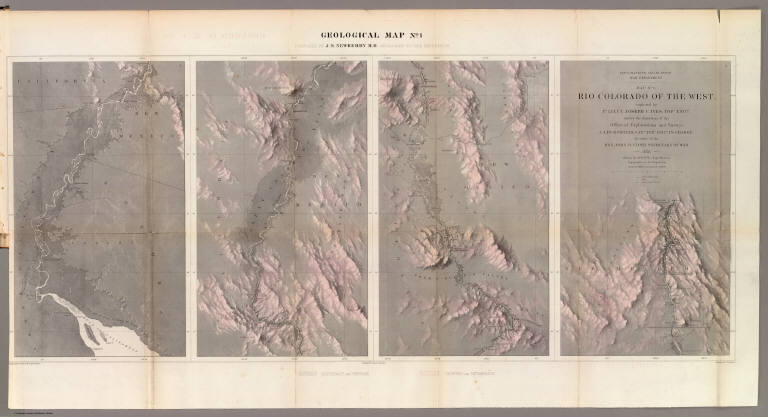
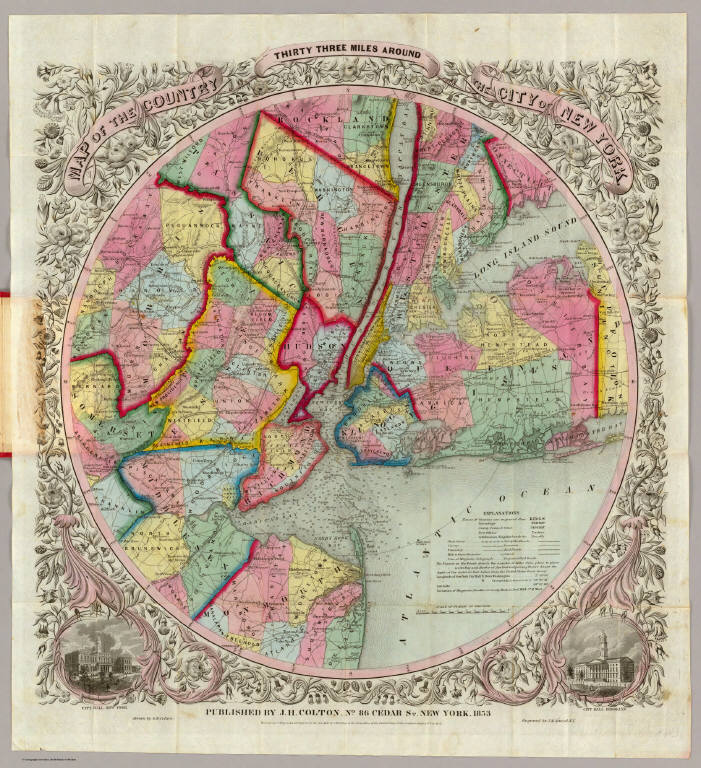
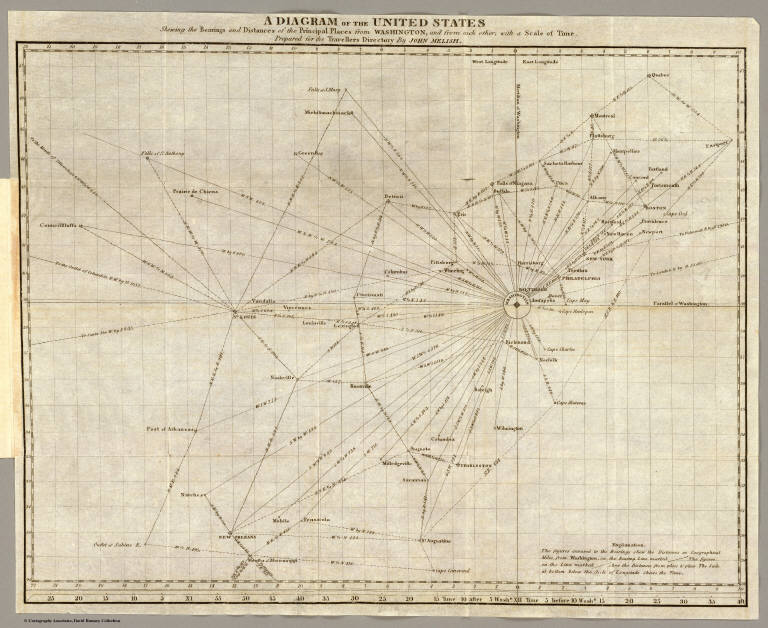
David Rumsey Historical Map Collection


Formation du Territoire Francais. Atlas St. Cyr. G. Hue et E. Dubail. Furne, Jouvet et Cie. Editeurs. Imp. Lemercier et Cie. Paris. Grave par J. Geisendorfer, 12 r. de l'Abbaye, Paris. (1882)


Chimney Peak. Colorado Exploring Expedition frontispiece. J.J. Young from a sketch by H.B. Mollhausen. Lith. of Sarony, Major & Knapp, 449 Broadway, N.Y. In Charge. (Washington: Government Printing Office. 1861. Senate. 36th Congress, 1st Session. Ex. Doc.)


Geological Map No. 1. Prepared by J.S. Newberry, M.D. Geologist to the Expedition. Explorations and Surveys. War Department. Map No. 1. Rio Colorado of the West, explored by 1st Lieut. Joseph C. Ives, Topl. Engrs. under the direction of the Office of Explorations and Surveys. A.A. Humphreys, Capt. Topl. Engrs. in Charge, by order of the Hon. John B. Floyd, Secretary of War. 1858. Drawn by Frhr. F.W.v. Egloffstein. Topographer to the Expedition. Topography by Frhr. F.W.v. Egloffstein. Ruling by Samuel Sartain. Lettering by F. Courtenay.


Map Of The Country Thirty Three Miles Around The City Of New York. Published By J.H. Colton, No. 86 Cedar St. New York, 1853. Entered ... 1846, by J.H. Colton ... New York. Drawn by G.W. Colton. Engraved by J.M. Atwood, N.Y.


A diagram of the United States shewing the bearings and distances of the principal places from Washington, and from each other, with a scale of time. Prepared for the Travellers directory by John Melish. (Philadelphia: Published by the Author. 1822)


Gran archivo de mapas en David Rumsey Historical Map Collection .

Psiquifotos


Camino Galicia, J. Manual práctico de exploración y examen de las facultades mentales. Imprenta A. Marzo. Madrid, 1924.


López Ibor, J.J. El libro de la vida sexual. Ed. Danae. Barcelona, 1968.


“Arc de cercle” en un hombre. Charcot - Richer, 1885


Es una pena que en el gran blog psiquifotos, las imágenes no sean de más calidad..aún así, recomendamos la visita para ver la gran cantidad de material posteado sobre las relaciones entre fotografía, arte y psiquitaría, introduciendo, entre otras cosas, mucho material bibligráfico de fuentes del territorio español.